| Главная » Статьи » Мои статьи |
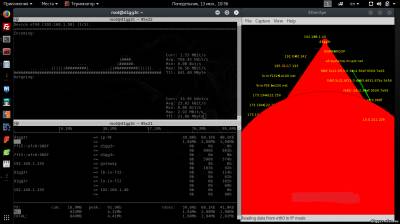
One of the main tasks of administrators and specialists in network security is controlling Network, network connections in real-time. This is what we will talk today, and we will consider three simple solutions to solve this problem. The first tool in our list is NLOAD. Nload - a console application which monitors network traffic in real time, and outputs the data channel load in the form of a drawing separately for inbound and outbound traffic. It also provides additional info like total amount of transferred data, the minimum and maximum bandwidth, etc. The installation is simple. Run the standard command
# apt-get install nload
Utility has several input parameters, we consider some of them: -i max_scaling – set scale (100% level) for incoming traffic, kBit/s. -o max_scaling – set scale (100% level) for outgoing traffic, kBit/s. The default value max_scaling = 10240 kBit/s. (i.e., ~10 MBit/s) -u b|b|k|K|m|M|g|g|h|H – sets the type of display units workload traffic (by default kBit/s). -U b|b|k|K|m|M|g|g|h|H – sets the type of units to display the sum of traffic counts (by default, in MByte/s). The interpretation of the values b|B in bits or in bytes, k|K in kilobits or kilobytes, m|m in megabits or megabytes, and g|G in gigabits or gigabytes, h|h automatic change type depending on the value. -t interval – set refresh interval of the screen in milliseconds (default 500 ms), that the interval of 100 ms. -m – displays all interfaces on the screen (without graphics output). In addition as a parameter you can specify a specific interface. In shared mode, toggle the display between interfaces is done by pressing arrows left and right or up and down. Now a couple of examples: # nload rl0 –i 2048 –o 4096 –u h –U M The displayed bandwidth on the interface rl0 maximum scale value for incoming traffic is 2048 kBit/s, the outgoing traffic and 4096 kBit/s, with automatic unit type depending on the values and count the amount of traffic in megabytes. The following command displays all available network interfaces: Lastly, a couple of useful function keys: F5 – to save display settings in the config file
Next on our list will be the tool IFTOP. IFtop is a tool for monitoring real-time network bandwidth via command line. IFTOP shows a real time updated list of network connections based on their network usage ordered on every second, on average, 2, 10 and 40. As in the previous case, to install the utility, run the command:
# apt-get install nload
Run a utility as simple as installing
# iftop
Or, if you have multiple network cards – you can run with-i and specify your desired:
# iftop -i eth0 (wlan0)
During operation iftop you can use keys like S, D to see more information like source, destination etc. iftop Utility supports the so-called pcap-filter syntax used in the batch filter and using the-f flag we're talking Tulsa that we were about to ship filtering: Here are the basic commands: -h display this message Sorting orders: The following options are only available in combination with -t The last tool in our list is EtherApe. EtherApe is a free program, packet analyzer/tool to monitor traffic. Network traffic is displayed using a graphical interface. Each node represents a specific host. Nodes and links are color-coded, to refer to a variety of protocols, forming different types of network traffic. Individual nodes and their connecting links grow and shrink with increasing and decreasing network traffic. EtherApe is a great tool to monitor bandwidth usage in your network. It gives a graphical representation of what proportion of lines are active and where. Upon failure of the IP or MAC addresses and classifications of protocols is the only tool that should be used. For example, if you find a noticeable slowdown in network performance and want to quickly see who takes your resources, start EtherApe. This program listens on your network and identificeret traffic in it, the protocols and the load on the network. In addition, it keeps track of all the sources and destinations of traffic and gives a clear picture of what is happening in the network. This program is a very good tool for identifying problems with the network, and can help in explaining the issues of bandwidth and traffic for non-experts in technical matters. EtherApe graphically demonstrates the network traffic. Nodes are drawn in the form of a ring with links in the form of lines. The more traffic, the thicker are the connecting lines.
Different traffic can be depicted in different colors that allow to distinguish its types. Set the same standard way:
# apt-get install etherape
On this, our review is finished. Good luck to everyone!
| |
| Просмотров: 1806 | | |
| Всего комментариев: 0 | |


